
Nov. 1, 2026
The area of a triangle can be found with (1/2) base ⋅ height, which makes sense because a right triangle is half of a rectangle with area base ⋅ height.
Hopefully, that formula already seems intuitively clear.
But we can also find the area of a triangle using calculus…
I like to think of calculus as geometry for weird shapes, but it can also be used to find the area of commonplace shapes like squares, triangles, and circles.
One way to think of integration is as a method of slicing up a shape into many thin strips, where the width of each strip approaches 0. In other words, you’re slicing the shape as thinly as possible.
The area of each slice can then be approximated by a rectangle with a width approaching zero and a height determined from the dimensions of the original shape.
The area of the shape can therefore be found by summing the areas of all these thin slices.
For example, consider a triangle with base = 5 and height = 10. We know from the basic geometric formula that the area is (1/2) 5 ⋅ 10 = 25.
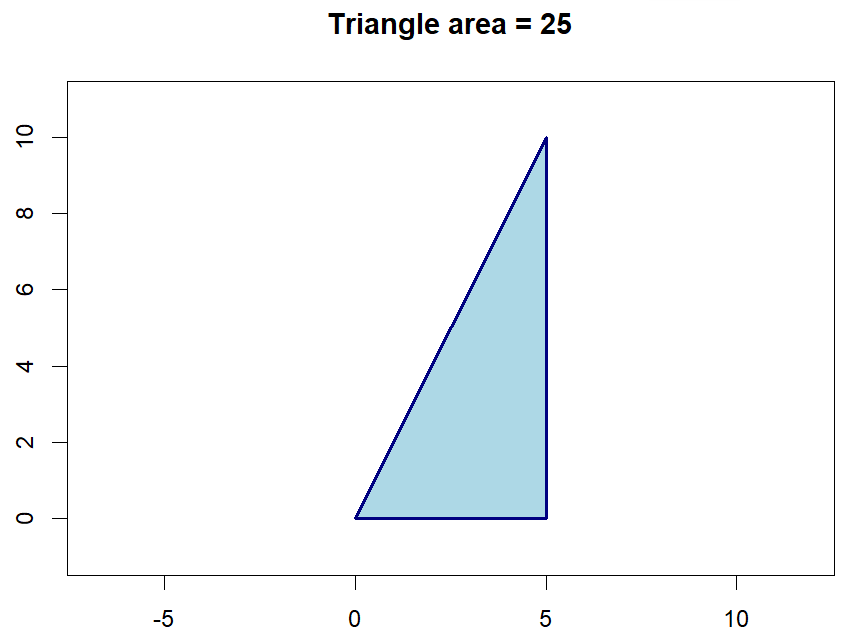
If we “sliced” this into vertical strips, the leftmost strip would have a height of 0, and the rightmost strip would have a height of 10. If we summed the areas of all the vertical slices from height 0 to height 10 (i.e., from x = 0 to x = 5), the total would be 25.
We can check whether our understanding of integration is correct using R code.
There are multiple ways to do this, but I’m going to approximate the correct answer by literally slicing the triangle into many very thin strips.
Specifically, I’m going to cut it into 50 million slices. (That’s a lot, but R can do it in a split-second.)
> # Triangle Dimensions> base=5> height=10> # Standard Area Check> (area=base*height/2)[1] 25> # Specifying 50 million slices> slices=seq(0,5,1e-07)
Now, how do we approximate the area of each slice? Each width has been defined as 1e-07 = .0000001.
If we examine the triangle, we’ll notice that the height of each vertical strip is twice its position along the x-axis (i.e., the distance from the left end of the triangle). For example…
- When x = 0, the height is 0
- When x = 2.5, the height is 5
- When x = 5, the height is 10
Another way of saying this is that the top edge of the triangle is a line described by y = 2x (the slope is 2).
So, now let’s identify the height of each slice….
> # Heights of slices> slice_heights=slices*2
And then combine the heights and widths into areas of each slice…
> # Areas = Heights * Widths> slice_areas=slice_heights * 1e-07
And the last step is to sum the areas of these slices…
> sum(slice_areas)[1] 25
Note that we only get precisely 25 because R displays just 7 significant digits by default. If we instruct R to be more precise, we’ll see that the calculation is not quite 25…
> # This is less precise than it seems...> print(sum(slice_areas),digits=15)[1] 25.0000005
But the narrower the slices we use, the more the result will dial in on precisely 25.
Okay. I think the concept has been demonstrated well enough.
Clearly, there are much more rigorous ways to approach this kind of thing. And I’m sure that any actual mathematician reading this would fly into a rage at the imprecision in my explanations and demonstrations.
But the point is we’ve written code to represent our understanding of the concept (integration), and this code accurately produced expected results to an acceptable degree of approximation.
Next time, I’ll apply the same concept to show how we calculate these magical p-values that stats folks are always talking about…

