Tag: understanding

  • Shallow Mastery

    Oct. 22, 2026

    Last time, I argued that Bloom’s Taxonomy does NOT necessarily represent progressively advanced levels of learning or understanding.

    For one thing, a task in the Remembering/Knowledge level could be extremely sophisticated (e.g., recall the names of all bones in the human body, as well as the origins of the names). Similarly, a task in the Evaluating level could be relatively basic (e.g., judge whether an x-ray depicts a broken bone).

    For another, regardless of the complexity of the task at hand, the person’s extent of understanding can fall anywhere along a continuum from shallow to deep…

    Like the ocean, shallow areas of understanding can be easily spotted from the surface; a few penetrating questions can usually reveal that someone doesn’t really know what they’re talking about.

    In contrast, deeper understanding is harder to gauge. Even when we can recognize that someone’s understanding isn’t shallow, the actual depth remains murky—as does the maximum possible depth in the topic, if there even is such a thing.

    Due to the way our brains work, we generally opt for shallow understanding. We tend to want the minimum viable understanding in order to be able to move on or apply the information.

    Consequently, a person could demonstrate “understanding” in all six levels of Bloom while still possessing very little depth of understanding in the relevant subject matter.

    To show this is true, consider anyone who has an advanced degree, yet understands very little of the subject with any depth. (I’ll give a generic example in a minute.)

    If you’re not familiar with academia, this may sound preposterous. But the truth is that many learners adopt a “learn-to-get-by” mentality, not a “learn-to-understand” mentality, and at many institutions that is enough to obtain an advanced degree.

    We can speculate about why this is the case, but that’s not the point here.

    Consider the fictional example of John Smith, who is a mashup of a variety of real people…

    John majored in psychology and statistics during college, then went on to get a masters degree in the social sciences with a quantitative specialization.

    (By the way, none of what follows is John’s fault, exactly—except insofar as he failed to claim responsibility for his own learning. The broader problem lies in how humans naturally think and how certain educational systems are designed.)

    What John was taught—and in some sense mastered—was a cookbook-style overview of statistics, where flowcharts guided all decision points and AI helped write code to conduct all analyses.

    For example, if a homework assignment asked John to compare the means of two independent groups, he looked at his flowchart and found that it instructed him to conduct an “independent samples t-test.” (In preparation for closed-book exams, John even memorized this If–Then rule in a basic pattern-matching way.)

    The AI confirmed the use of a t-test and provided R code to produce summary statistics [e.g., mean() ] and test results [e.g., t.test() ]. The results were interpreted according to complicated decision rules about what the numbers do or do not mean.

    Depending on the program of study, John might also have learned about statistical assumptions, which are in turn evaluated with their own bevy of procedures and decision rules.

    John followed all required steps, submitted the requested information, and was awarded an “A.” Many such instances, across a variety of different problem scenarios and respective procedures, resulted in successful graduation from the program.

    Notice that all six levels of Bloom’s Taxonomy have been addressed many times over. For example…

    1. Remembering/Knowledge: John accurately recalled the names of the appropriate statistical tests for a variety of data analysis situations, as well as the associated R functions to run the rests.

    2. Understanding/Comprehension: He successfully paraphrased various statistical concepts (e.g., a 95% confidence interval was described as, “The interval within which the population parameter would fall in 95% of repeated samples.”)

    3. Applying: He correctly ran countless analyses on homework assignments and exams according to flowcharts and decision rules.

    4. Analyzing: He parsed and interpreted statistical output (e.g., effect sizes were extracted and interpreted according to Cohen’s guidelines; p-values were extracted and interpreted as “statistically significant” or not according to an α = .05 threshold).

    5. Evaluating: He scrutinized published research papers during class sessions to determine (a) whether the authors ran the correct analyses; (b) if the reported results are correct; and (c) whether the conclusions align with the results.

    6. Creating/Synthesis:
    He conducted his own research projects, analyzing the results and perhaps even publishing them in scientific journals!

    Despite all this, a few penetrating questions might cause it all to fall apart like a house of cards.

    • Why does the flowchart say to run an ANOVA rather than a t-test? Why is one test “right” and the other “wrong”? Why is that rule the rule?
    • Where does that p-value come from? Why does it tell us anything about how to think about the results? What’s the difference between p = .0499 and p = .0501?
    • If we were feeling particularly cruel, we might ask basic questions about degrees of freedom—a concept John would have learned about in the first week or two of the program, but which is rarely understood by either students or instructors!

    Even if a response to any of these questions could be mustered, a follow-up question of, “But what does that mean?” would probably be the death blow.

    Why would these basic questions stump John?

    Because the only depth that has been established is with respect to the flowcharts and decision rules, not the why and how of statistical mechanics. (And certainly not the underlying phenomena being studied.)

    So much of learning is skimming along the surface, weaving a web of tenuously connected concepts, where much of it is accepted without question.

    Again, this isn’t because John is stupid or unmotivated (necessarily). It’s because he’s faced with an infinite barrage of information from every direction, and he needs some way to prioritize and get through it all. He’s probably not even consciously aware he’s doing this.

    But this is what he’s doing if the answer to the question, “Why?” is, “Because that’s the rule.”

    Why do we care? If John can get the correct results, then does it really matter?

    It DOES matter, because this flimsy kind of understanding tends to fall apart in real-world analytic situations, which call not for flowcharts but judgment and nuance.

    Additionally, superficial understanding is more easily replaced by AI than deep understanding is, so there’s not much job security for John in the current age.

    Now, I know it may seem like I’m being really mean to John in this post…

    But the truth is that we are ALL John.

    We all have certain domains of knowledge in which we don’t really understand what’s going on with much depth, even if we’ve completed high school, college, trainings, etc.

    In many domains we don’t need deep understanding.

    I’m worse than John when it comes to car engines. I don’t even know where to start. But things have pretty much worked out so far, because that’s not my area.

    The question is, What’s the domain (or two or three) where you ARE going to have deep understanding?
  • Levels of Bloom’s Levels

    Oct. 21, 2026

    You might think that Bloom’s Taxonomy makes the concepts of learning or understanding complicated enough, but the model is actually more complicated than I previously let on—and I would argue that the reality is even more complicated than the full model suggests!

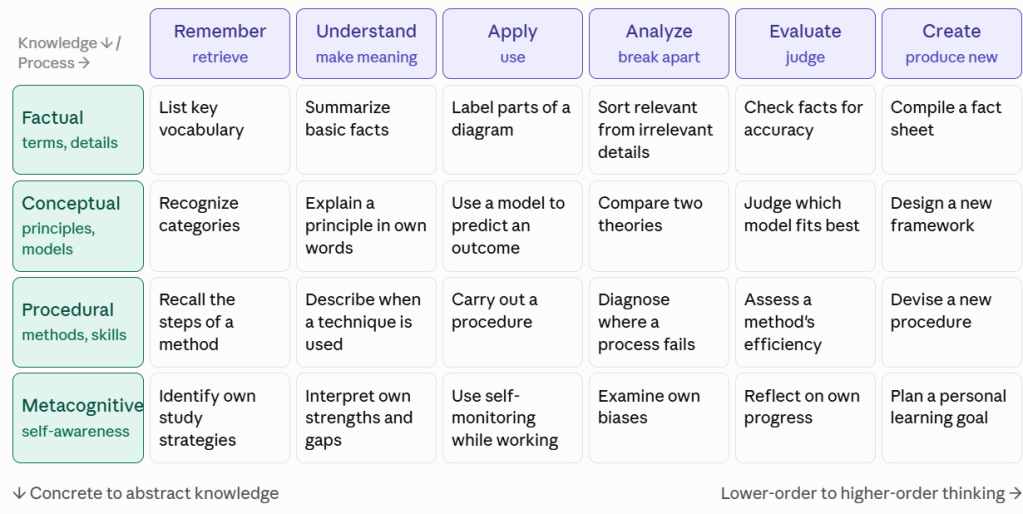
    Here’s the 2001 revision of the model, which still breaks learning down into 6 levels of generally increasing complexity…

    1. Remembering
    2. Understanding
    3. Applying
    4. Analyzing
    5. Evaluating
    6. Creating

    If you’re paying attention, you’ll notice that the 5th and 6th levels are swapped in the revised version. Additionally, the levels are now framed as verbs. (This is due to how educators write learning objectives, which is one of the primary uses of the taxonomy.)

    Previously, I described the levels in a general “overview” way. In actuality, scholars have broken down each of the six levels into sub-components. For example…

    • Remembering breaks down into identifying and recalling (think “matching” vs. “fill-in-the-blank” test questions).
    • Understanding breaks down into several dimensions, including classifying, comparing, explaining…
    • Evaluating breaks down into checking and critiquing.
    • Et cetera

    Additionally, the different levels can be mapped against different types of knowledge (e.g., factual vs. procedural).

    Here’s a 2D representation of this idea, with example tasks in each cell (courtesy of Claude):

    (For details on the actual revised model from the scholars themselves, check out Anderson & Krathwohl [2001].)

    But even within this more nuanced framework, I would argue that there are degrees of understanding at each level and its component dimensions, on a spectrum from shallow to deep.

    For example, in the Remembering/Knowledge level, consider a person’s recall of facts in a subject area. Their extent of recall could be…

    • Shallow (e.g., remember a few introductory key terms)
    • Deep (e.g., remember many advanced terms)
    • Or anywhere in between

    Or in the Understanding/Comprehension level, consider a person’s ability to explain some mechanical process, such as how a lightbulb works. Again, their extent of explanatory ability could be…

    • Shallow (e.g., vaguely describe the general process)
    • Deep (e.g., describe the process in great depth and in multiple ways)
    • Or anywhere in between

    This is called explanatory depth.

    I’m not the only person who has thought of this, by the way. For example, Biggs & Collis (1982) published a model of what is essentially depth of learning, which they map onto cognitive developmental stages.

    Additionally, the concept of explanatory depth is the subject of an entire research literature—the illusion of explanatory depth (i.e., the study of how we typically LACK the ability to explain causal processes with as much depth as we think we can).

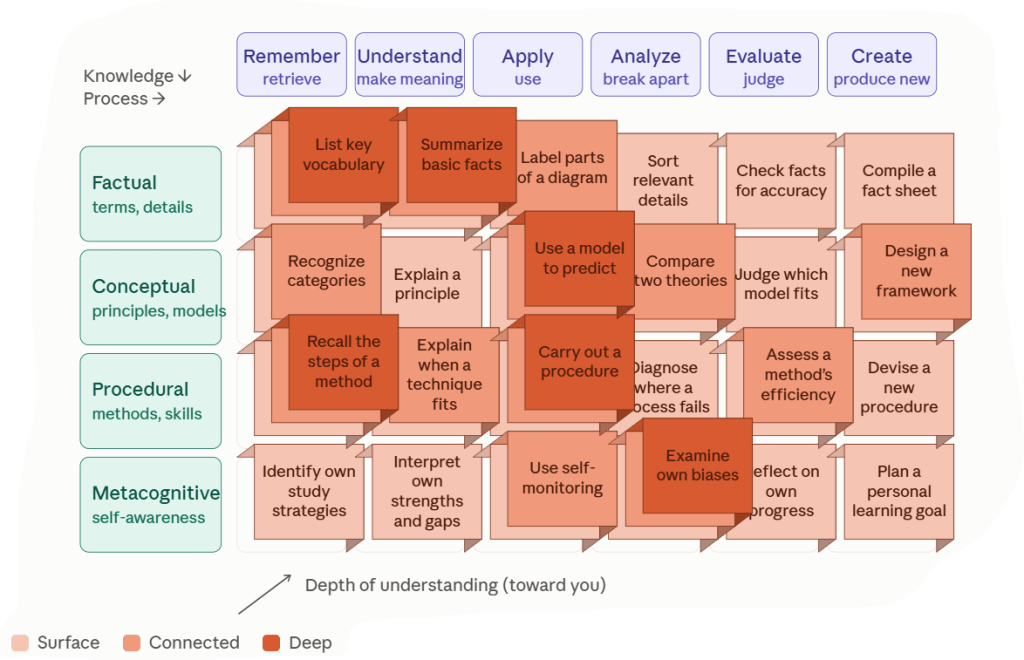
    It doesn’t look as clean, but I had Claude add a third dimension to the previous image to represent depth of understanding. (Appropriately, if the other two axes represent length and height, then this third dimension represents literal depth.)

    This is an attempt to illustrate how different demonstrations of knowledge can occur with varying amounts of depth; therefore, it is not as simple as higher-order processes always representing greater depth of understanding.

    (Granted, I suspect that higher-order levels such as Creating generally do correspond to deeper understanding than lower-order levels such as Remembering; my argument is only that it’s not guaranteed.)

    In this way, I view Bloom’s Taxonomy merely as six types of activities relating to knowledge. This argument doesn’t make the framework any less useful, but it does reveal a clear problem…

    A person could technically demonstrate “understanding” in all six of Bloom’s levels while still having basically no idea what they’re talking about.

    Reflecting on my own learning process, as well as what I observe in others, it seems to me that “shallow mastery” is more common than we’d like to believe, and it’s far less common than deep understanding.

    More on this next time…

  • Levels of Understanding

    Oct. 20, 2026

    What does it mean to understand something?

    The question, “How do you know if you understand something?” proves surprisingly difficult to answer. The more you grapple with it, the less it even seems like a sensible question to ask.

    Perhaps it’s better to conceive of understanding NOT as a binary classification (i.e., one either does or does not understand) but rather in terms of degrees (i.e., one understands to what extent and in what ways).

    An extremely popular model of levels of understanding is Bloom’s taxonomy, which outlines 6 levels of learning or understanding…

    1. Knowledge—Identifying concepts
    2. Comprehension—Summarizing related concepts
    3. Application—Using concepts to solve problems
    4. Analysis—Breaking down related concepts to explain how they are connected
    5. Synthesis—Building superordinate ideas by combining concepts
    6. Evaluation—Making judgments based on understanding of the concepts

    Sometimes there are different variations of these terms, definitions, or order, but it doesn’t really matter.

    (As an aside, it’s always popular for people to argue about the validity or structure of popular models like this, but I think it’s mostly a waste of time. There is no “official” or “complete” framework of such categories.

    This framework is simply one way to think about more or less advanced levels of understanding.)

    Let’s take a basic example from data analysis: the average (what in statistics we call the arithmetic mean)…

    1. Knowledge

    Demonstrating knowledge might include writing down the formula…

    M = Σx/n

    Often, when I ask students what the “mean” is, they say something like, “Add up the parts and divide by the number of parts.” (A verbal statement of the formula.)

    This is 100% correct, but that is often the extent of most people’s understanding.

    When I ask…

    • “And what does that mean?”
    • “Why would we add up the parts and divide by the number?”
    • “What does the result tell us?”

    …I am usually met with silence.

    This might reflect that they have only memorized some surface-level features of the concept in a pattern-matching way.

    Or it’s possible that they do understand at a deeper level, but they’re less confident in that explanation, so they’re reluctant to put themselves out there in front of the class and risk embarrassment.

    Either way, their grasp is limited in some sense.

    A deeper level of understanding is represented by…

    2. Comprehension

    Demonstrating comprehension might involve expressing the concept in your own words…

    For example, here’s the explanation of the mean that pops into my head in this moment:

    “The arithmetic mean is a single summary value intended to represent an entire collection of scores. It is equivalent to taking the total of the scores and slicing it into equal-sized parts, which gives some sense of what the ‘typical’ score looks like.”

    There are other (better) definitions out there, but this is not a bad one.

    The only way I’m able to articulate this on the spot is that I have some sense of the concept in my mind, beyond a memorized definition.

    To me, this description carries more explanatory power than reciting the formula alone does.

    Without this deeper level of understanding, it’s not really clear why you would ever bother to calculate the mean in the first place!

    3. Application

    Applying the concept might involve using it to solve a real-world problem…

    Suppose a new worker is completing a series of four online safety training modules, and they need an average quiz score of 80% to pass. If their scores so far are 75, 90, and 85, what minimum score do they need on the final quiz in order to pass?

    There are many ways to find the answer, but one is to treat it as an algebra problem that uses the formula and an unknown…

    (75 + 90 + 85 + x) / 4 ≥ 80

    Solving for x yields…

    x ≥ 70

    They need at least a 70% on the final quiz to pass. Since the employee has never scored that low on a quiz so far, their odds seem good!

    4. Analysis

    Analysis involves breaking the concept down. Analyzing the mean might involve taking apart the formula and examining the implications of each part’s inclusion.

    For example, the arithmetic mean boils down to totaling the scores (Σx) and dividing by the number of them (n).

    Because every score (x) contributes to the total (sum, Σ), one implication is that any single value could be highly influential in determining the final result.

    Consider these two example distributions, which are identical except for their final values…

    A = (1 2 3 4 5)

    B = (1 2 3 4 500)

    Here are the mean calculations in R…

    > A=c(1,2,3,4,5)
    > paste('The mean of A is',mean(A))
    [1] "The mean of A is 3"
    > B=c(1,2,3,4,500)
    > paste('The mean of B is',mean(B))
    [1] "The mean of B is 102"

    The average is over 30 times larger in the second case. Clearly, a single datapoint can have a substantive impact on the mean.

    This seems obvious once you consider how every single score is contributing to the total, but it’s not obvious to most people who only have a vague grasp of what an average really is.

    5. Synthesis

    In some ways, synthesis is the opposite of analysis (going the other direction), because rather than breaking things down, we are building things up.

    To me, this often seems like a more creative version of application…

    For example, imagine an employee listening team is monitoring morale with pulse surveys randomly sent out to different segments of the workforce daily. To make sense of and use the data, they might synthesize the insights to create some kind of reporting protocol.

    For instance, perhaps they average scores to an engagement item daily (application). But they notice that scores are lower on Monday and higher on Friday (analysis), so they proceed to average the daily scores into weekly scores.

    Then, perhaps they notice random spikes up or down on certain weeks (analysis), which detracts from the overall picture of how engagement is progressing. So they begin calculating rolling 3-point averages to smooth out the jaggedness in the overall trend.

    In this case, the output (maybe some kind of dashboard) is a combination of many components, including some averages and variants of averages.

    6. Evaluation

    Demonstrating the ability to evaluate could involve making judgments that involve understanding of averages.

    For example, suppose a corporate firm reports that their average (mean) annual salary is $140,000 companywide.

    Someone who understands that the mean is dragged in the direction of outliers would (hopefully) immediately recognize that this average pay level could reflect that everyone in the firm makes about that amount…

    …or it could just as easily reflect low pay in general, combined with astronomical pay for a handful of C-suite executives.


    I have my own quibbles with Bloom’s Taxonomy (including the revised version, which I didn’t mention), but overall it’s a useful way to think about different levels of depth in understanding that are possible.

    But even within a given level, there can exist shallow versus deep understanding…

  • How Do You Know if You Understand Something?

    Oct. 19, 2026

    Question: How do you know if/when you understand something?

    Is a flash of insight enough?

    Sometimes it intuitively feels like we understand a concept, perhaps especially when we experience a sudden burst of clarity.

    But that’s not understanding…that’s just feeling like you possess understanding.

    And we know that feeling can be wrong, because we periodically discover we’ve been mistaken about a belief that previously felt intuitively clear.

    Is it that we can correctly answer questions about the topic?

    It does seem true that if you understand something, you should be able to answer questions about it. This also aligns well with our intuitions based on educational systems where knowledge is evaluated in this way.

    But how do we know that we’re being asked the right questions in the first place? Additionally, how do we know that answers deemed “correct” are reflective of true understanding?

    Consider this question, which is exactly the sort of thing that is often posed to college students in Intro Stats courses:

    To compare the means of two independent groups, which statistical test would be appropriate?

    A. t-test
    B. ANOVA
    C. Regression
    D. Correlation

    A student who selects “t-test” as their response might get a good grade on the assignment. And if they answer many such questions, they might get a good grade in the class.

    If they then complete multiple statistics courses, they might come to believe they understand statistics well.

    The problem, however, is that all four answer choices would have been correct! These are different ways of representing the same concept (see this video explanation).

    In this case, the instructor’s own lack of understanding trickles down to the students. For them, “learning” just amounts to a sophisticated form of pattern-matching, where the link between a prompt (“comparing means of two independent groups”) and a response (“t-test”) is memorized.

    As shown above, this form of pattern-matching can happen without there being any deeper understanding of what is actually going on.

    So, clearly, being able to get the “right answer” to questions on the topic does not necessarily signal understanding.

    Indeed, having completed trainings, certifications, courses, or even entire degree programs does not necessarily indicate that the learner possesses understanding of the relevant subject.

    Is it that others describe us as possessing understanding?

    For example, if everyone around you gushes about how well you grasp a particular subject, does that make it true? What if recognized authorities on the subject formally induct you into their ranks based on long and careful judgment?

    This could certainly make us feel like we understand, at least if we’re inclined to take others’ word for it.

    But does it really make sense to equate understanding (a psychological state inside your head) with social perception (a psychological state inside others’ heads)?

    That seems wrong by definition.

    Maybe if we don’t believe that “objective understanding” is even possible, because of the natural limits of how our brains work, then we would be satisfied to conceptualize understanding as a purely social construct?


    In fairness, although they’re limited, I do think each of these could be useful indicators of what we call understanding, especially when taken together:

    • You perceive that you grasp a concept.
    • Others agree, including others who are also thought to possess understanding of the concept.
    • You successfully pass tests intended to measure understanding.

    But even with all these criteria taken together, it’s not difficult to imagine a situation where you still don’t really understand, because no one involved really understands.

    (This is not that far-fetched. It’s arguably the case for any system so complex that we can’t make high-accurate predictions.)

    It everyone misunderstands how things work, and that misunderstanding is also reflected in the tests/questions, then achieving all these criteria still doesn’t grant something like “objective” or “true understanding.”

    So maybe we never truly know whether we understand…

    In which case, “How do you know if you understand something?” is not a meaningful question to pose.

    Perhaps part of the issue is that understanding is not actually a binary state in your mind.

    Maybe the question is not “Do you understand?” but rather “How well do you understand?”